In the first quarter of 2026, clean energy and transportation investment in the United States totaled $61 billion, a 3% decline from Q4 2025 and a 9% decline from Q1 2025. This marked the second quarter in a row with a year-over-year decline, following an unbroken year-on-year growth trend that had held since 2019. Clean investment accounted for 4.2% of total private investment in structures, equipment, and durable consumer goods in Q1 2026, roughly stable from last quarter but down half a percentage point from Q1 2025.
Investment in our clean technology manufacturing segment fell for a sixth consecutive quarter, to $8 billion, its lowest level in almost three years. That represents a decline of 11% relative to Q4 2025 and 34% compared to Q1 2025. Announced investment in clean tech manufacturing totaled $2 billion in Q1 2026, down 37% relative to Q4 2025 and 79% relative to Q1 2025, representing the lowest level in more than five years. Companies also canceled nearly $2 billion of previously announced manufacturing investments during this period.
Investment in retail consumer purchases of electric vehicles (EVs) and other clean technology (heat pumps, distributed generation, and storage) remained stable from Q4 2025 at $28 billion, but this marked a 17% decline compared to Q1 2025. EV sales remain the biggest component of our retail segment at $18 billion or 64% of the total, roughly flat from the previous quarter.
Investment in clean energy production and industrial decarbonization technologies reached $25 billion in Q1 2026, a 6% decline from Q4 2025 but a 15% increase relative to Q1 2025. New announced investment in clean energy and industry decarbonization totaled $62 billion in Q1 2026, with a significant portion (43%) tied to a $27 billion nuclear project. Developers canceled roughly $11 billion of previously announced investments in energy and industry projects this quarter.
Despite the quarterly decline, investment in clean energy production over the past four quarters was significantly higher than the year prior. In addition to summarizing trends from our quarterly update to the Clean Investment Monitor, this report examines this acceleration of investment in clean energy deployment. Cumulative investment in utility-scale solar, wind, storage, nuclear, and other clean technologies grew 29% over the past year (Q2 2025 to Q1 2026) to $105 billion, compared to $82 billion during the prior year (Q2 2024 to Q1 2025), marking the largest sustained four-quarter investment period since the start of our tracking in 2018. Within the top 20 states with the most clean electricity investment since 2018, we provide snapshots of the six states that experienced the biggest rise year-over-year.
Investment trends
Actual clean energy and transportation investment in the US in the first quarter of 2026 stood at $61 billion, a 3% decline from the previous quarter, and a 9% decline from Q1 2025 (Figure 1). Q1 2026 marks the second consecutive period in our tracking of negative year-over-year growth in clean investment. From Q1 2019 to Q3 2025, quarterly investment has surpassed the level observed in the same period of the previous year—even when quarter-on-quarter declines occurred. That trend ended in Q4 2025, when investment declined 7% from the level observed in Q4 2024, and was repeated this quarter, dropping 9% compared to Q1 2025. In Q1 2026, clean investment accounted for 4.2% of total US private investment in structures, equipment, and durable consumer goods nationwide, declining slightly (0.2 percentage points) from the previous quarter and down by half a percentage point from Q1 2025 (Figure 2).
We categorize our clean investment tracking into three segments: investment in the manufacture of GHG emission-reducing technology (“manufacturing”); investment in the deployment of that technology, both to produce clean energy or decarbonize industrial production (“energy and industry”); and investment through the purchase and installation of that technology by individual households and businesses (“retail”). Each dollar figure in this report reflects actual investment—the real dollars spent in the given quarter on retail purchases, facility construction, and equipment purchase and installation. For facilities, we track actual capital expenditures invested over the construction timeline once a project breaks ground. In the following sections of this report, we summarize actual and announced investments, which provide context and insight into potential future actual investments.
Retail investment accounted for the majority (46%) of total clean investment in Q1 2026 at $28 billion, increasing slightly by 1% relative to Q4 2025, and declining 17% compared to Q1 2025. In Q1 2026, manufacturing investment decreased for a sixth consecutive quarter to the lowest amount in almost three years, $8 billion, falling 11% quarter-on-quarter and down 34% compared to Q1 2025. In the energy and industry segment, $25 billion was invested in clean energy production and industrial decarbonization in Q1 2026, a 6% decline from the previous quarter, and a 15% increase compared to Q1 2025. Notably, energy and industry was the only investment segment to record year-on-year growth this quarter.
Project cancellations totaled $2 billion in clean technology manufacturing projects, an 81% drop from the previous Q4 2025 record-high of $8 billion in cancellations. Developers canceled roughly $11 billion of previously announced investment in clean electricity and industrial decarbonization projects, representing the third-highest quarter of cancellations in our tracking.
Manufacturing
In Q1 2026, manufacturing investment fell 11% from the previous quarter to $8 billion, a 34% decline compared to Q1 2025. This is the lowest investment total for this segment in almost three years. With the exception of critical mineral projects, investment fell quarter-on-quarter across all technology categories.
The EV supply chain—critical minerals, batteries, vehicle assembly, and charging equipment—continued to dominate clean manufacturing investment in Q1 2026, accounting for 89% of all investment at roughly $7 billion (Figure 4). However, investment in the EV supply chain declined for a sixth consecutive quarter, falling 10% from Q4 2025, and 36% relative to Q1 2025. Battery manufacturing investment experienced the steepest decline, falling 16% relative to Q4 2025 and 47% from Q1 2025, to $5 billion. Investment in critical mineral projects increased both relative to Q4 2025 and relative to Q1 2025, at 36% and 22%, respectively. EV assembly investment declined 2% relative to Q4 2025, but climbed 18% relative to Q1 2025.
Solar and wind manufacturing project investment fell 22% and 2% from Q4 2025, to $700 million and $20 million, respectively. Additionally, investment in solar manufacturing declined 15% relative to Q1 2025, whereas wind manufacturing investment quadrupled over the same period.
Newly announced manufacturing investment totaled $2 billion in Q1 2026, a 37% decline relative to the previous quarter and a 79% decline from Q1 2025. This marks the lowest quarterly level of announced manufacturing investment in over five years. Critical minerals accounted for $1 billion of the Q1 2026 total. Announced investment surpassed cancellations by around $400 million this quarter, representing growth in the pipeline after last quarter’s contraction, when cancellations exceeded announcements by $5 billion.
Retail
Consumer spending on zero-emission vehicles (ZEVs), distributed renewable electricity generation and storage, and heat pumps totaled $28 billion in Q1 2026, remaining relatively flat from the previous quarter and representing a 17% decline relative to Q1 2025.
EV sales continued to drive the majority of retail investment in Q1 2026, accounting for 64% of total quarterly investment at around $18 billion. EV investment remained relatively flat from Q4 2025 (up 1%), possibly signaling stabilization after the 30D consumer EV tax credit expiration in Q3 2025. Investment in EVs was down 23% relative to Q1 2025 (Figure 5).
Distributed electricity generation and storage investment totaled $5 billion in Q1 2026, down by a fourth relative to the previous quarter, and down 6% relative to Q1 2025. Heat pump investment reached $5 billion, representing a 48% jump quarter-on-quarter and no notable changes relative to this same period last year. Consumer tax credits to support the purchase and installation of heat pumps and distributed electricity & storage expired at the end of Q4 2025.
Energy and industry
In Q1 2026, $25 billion was invested in clean energy production and industrial decarbonization, a 6% decline from Q4 2025, but a 15% increase compared to Q1 2025. Within energy and industry, $24 billion (97%) went toward clean electricity, with industrial decarbonization accounting for the remaining share.
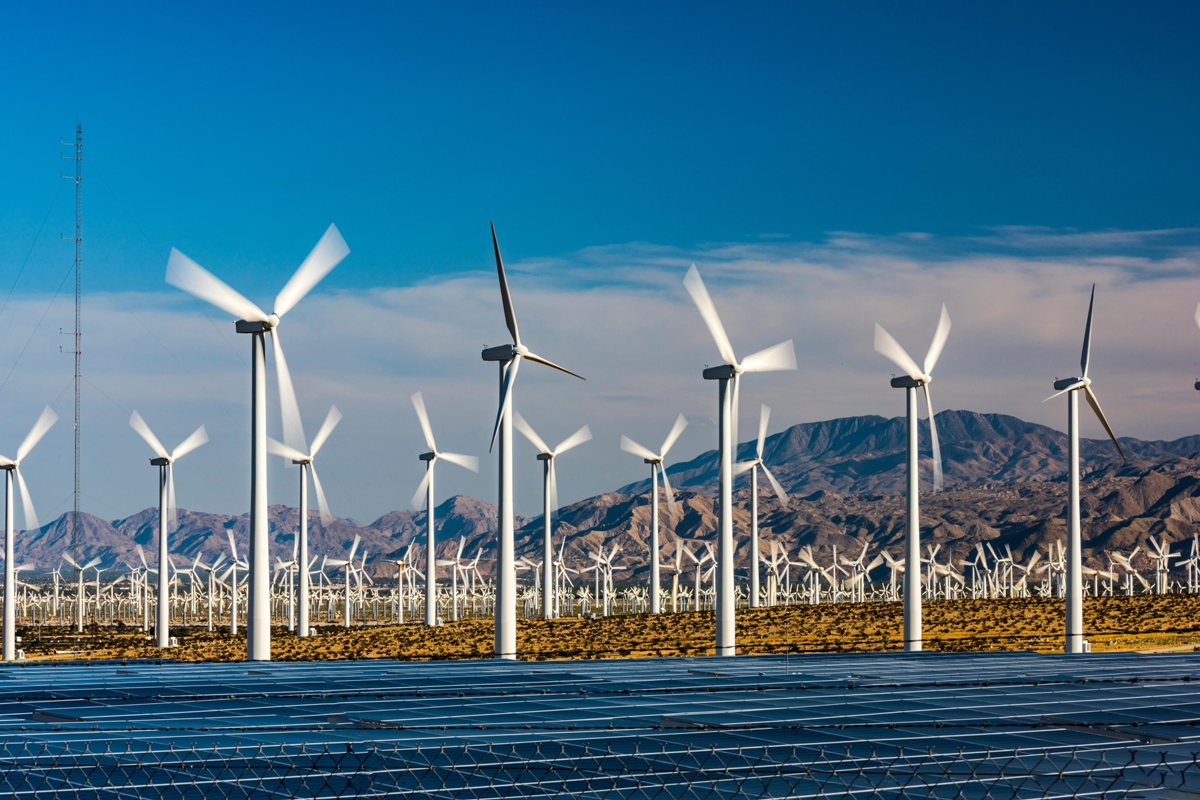
Utility-scale solar and storage installations continued to make up the majority of clean electricity investment at $18 billion, down 6% from Q4 2025, but up 6% relative to Q1 2025 (Figure 6). Wind investment declined 10% from the previous quarter to $6 billion, but was up notably (56%) compared to the $4 billion recorded in Q1 2025.
Industrial decarbonization investment totaled roughly $1 billion in Q1 2026, jumping by over a fourth from the previous quarter, but down 8% relative to Q1 2025 (Figure 7). Hydrogen continued to lead at around $400 million, with investment jumping by 27% compared to Q4 2025, but declining 11% relative to the same period last year. Carbon management investment followed suit with over $200 million invested, a 72% increase from the previous quarter and a 63% jump from the same period last year. Sustainable aviation fuel (SAF) investment decreased slightly by 2% quarter-on-quarter to $60 million, and declined 46% relative to Q1 2025. Clean fuels investment dropped by a fifth quarter-on-quarter, while clean iron and steel remained steady. No new investment was made in novel clean cement technologies this quarter.
Announced investment in clean electricity projects totaled $62 billion in Q1 2026. A large share (43%) of this investment comes from a nearly $27 billion nuclear project announced this quarter in Texas. Announcements in solar projects totaled $17 billion, while storage projects totaled $10 billion, together accounting for 44% of the announced share. Wind projects totaled $6 billion this quarter. Industrial decarbonization investment announcements totaled $1 billion, a notable jump from the $400 million in announcements during the previous quarter. SAF accounted for the majority share of announced investment at 94%.
Cancellations across the energy and industry segment reached $11 billion in Q1 2026, jumping 8% from the $10 billion in cancellations in the previous quarter, and representing the third-highest cancellations quarter since the start of our tracking in 2018. Clean electricity projects accounted for the majority share of cancellations in this segment this quarter at 95%.
Clean electricity investment growth over the past four quarters
Despite the Q1 2026 decline, investment in clean energy production across the US increased significantly over the last four quarters as a whole, relative to the year prior. The uptick occurred amid shifting electricity demand expectations, changes to the federal tax credits supporting these projects, and growing permitting uncertainty. Cumulative investment in utility-scale solar, wind, storage, nuclear, and other clean technologies grew 29% over the past year (Q2 2025 to Q1 2026) to $105 billion, compared to $82 billion during the prior year (Q2 2024 to Q1 2025). This marks the largest sustained four-quarter period of clean electricity investment since the start of Clean Investment Monitor tracking in 2018.
Although cumulative clean electricity investment remains concentrated in historically large markets, such as Texas, California, Arizona, and Florida, the Clean Investment Monitor’s quarterly data shows investment growth accelerated most rapidly over the past year in a smaller group of states, each reflecting different technology-specific dynamics across the US. Among the top 20 states by cumulative utility-scale clean electricity investment since 2018, Virginia, Colorado, New Mexico, Oklahoma, Michigan, and New York recorded the largest year-over-year increases during the past four quarters (Figure 8). Clean electricity investment in each state at least doubled year-over-year. Together, these six states account for 16% of the total clean electricity investment since Q1 2018, at $80 billion.
Nationally, investments in wind have seen the largest growth over the past four quarters relative to the previous year, more than doubling investment levels on an annual basis from $12 billion to $26 billion. At the same time, administrative barriers, including temporary stop-work orders on offshore wind projects and permitting pauses on onshore wind projects, have caused turbulence in the sector. Wind is the primary driver of clean electricity investment surges in New York, New Mexico, Virginia, and Colorado. In Virginia, total clean electricity investments jumped over $6 billion year-over-year, with wind accounting for 84% of the total over the past four quarters. The increase in Virginia reflects the construction activity tied to Dominion Energy’s multi-billion-dollar Coastal Virginia Offshore Wind project, which paused briefly towards the end of 2025, and resumed work early in 2026. New Mexico experienced a notable increase coming from wind projects. Overall, clean electricity investment in New Mexico grew from $2 billion to $6 billion year-over-year, with a significant share (68%) of investments coming from wind, specifically the SunZia onshore wind project. Clean electricity investments in Colorado jumped from $1 billion to $3 billion, with 54% coming from wind projects. For clean electricity projects in New York, investments nearly doubled from $2 billion to $4 billion invested between Q2 2025 and Q1 2026. Wind projects accounted for 78% of total clean electricity investment in New York over this period, with two multi-billion-dollar offshore wind projects, Empire Offshore Wind and Sunrise Wind, off New York’s coast, contributing to investment totals over this period. These projects were also affected by the stop-work orders in late 2025.
While solar investment saw a less dramatic increase over the last four quarters relative to the prior year, it still accounts for 46% of all clean electricity investment across the US. Investment in solar projects made notable contributions to the acceleration of clean electricity investment in Oklahoma, Michigan, and Colorado. Solar investment rose 86% year-over-year in Michigan, accounting for 82% of clean electricity investment in this state over the past four quarters. In Oklahoma, nearly half of the $3 billion in new clean electricity investment over the past year came from solar projects, although investment activity slowed after Q3 2025, due to a narrowing pipeline of wind and storage investments. Colorado solar investment jumped 81% year-over-year.
Wind and solar electricity generation projects were subject to some of the most significant changes in tax credit eligibility under the One Big Beautiful Bill Act (OBBBA), which was signed into law in Q3 2025. To qualify for clean electricity tax credits, wind and solar projects must commence construction by July 4, 2026, or be placed in service by the end of 2027. The earlier construction deadline for clean solar and wind projects will be a major signal to track in the upcoming quarters to determine whether the clean electricity surge over the past year is a pull-forward effect or a sustained trend. In the past, revised tax credit deadlines have coincided with shifts in clean investment activity. For instance, the consumer EV tax credit (30D) expired at the end of Q3 2025, when we tracked a sharp increase in retail investment tied to EV sales that same quarter. Subsequently, investment in EV sales declined 43% from Q3 to Q4 2025, and remained flat in Q1 2026. Looking ahead, 2026 may see record clean additions, with 55 GW of new clean capacity currently planned, primarily wind and solar (excluding batteries and hydroelectric storage). This would mark a substantial increase from previous years. Clean capacity additions in 2025 remained relatively flat from 2024 at roughly 35 GW.
Storage investment has also accelerated in several states experiencing strong growth in wind and solar. Unlike wind and solar projects, standalone storage retained longer tax credit eligibility under OBBBA, with credits remaining available until the end of 2033. Investments in storage projects grew from $100 million to $300 million in Michigan year-over-year, accounting for 10% of all clean electricity investments made in the state during this period. Virginia also experienced a surge in storage, with $300 million in new investment from Q2 2025 onwards, compared to no storage investments during the prior year. Storage projects in New Mexico accounted for 16% of investments over the past year and grew by a fifth, relative to the year prior. In Oklahoma, storage investments grew from around $200 million to $400 million, whereas investments in storage projects grew by three-fifths in Colorado.